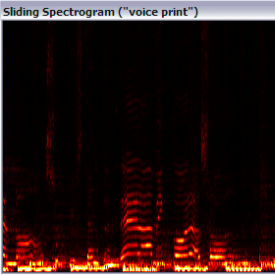
Sliding Spectrogram
A simple spectrogram to watch mid-low frequency changes, mostly on voice range.
A simple spectrogram to watch mid-low frequency changes, mostly on voice range.Just a simple spectrogram (AKA: short time Fourier analysis, time-frequency Fourier analysis).
I wrote this plugin to be able to watch mid-low frequency changes, mostly on voice range.
Comes in handy to watch female voices solos, such as those that appear in Gothic Metal.
You can select to view the spectrogram windowed or fullscreen, and you can change the palette used to map the Spectrum amplitude to colors.
This plugin was written in Delphi and it's freeware, you may get the source by e-mailing me.
| January 29, 2007 by Hector Laforcada | 110405 downloads |

Staff review
SpectrogramThis is basic though does have a full screen mode but otherwise it's level of integration was pretty low (not in a skinned frame so it can't be embedded in modern skins) and it's behaviour when Winamp wasn't playing could be tweaked. Works but nothing special.
Comments
Cool - This is exactly what I have been looking for, thank you very much! It is really interesting to watch the spectogram, especially when playing electric music (such as Drum'n'Bass) because you can often see filter envelopes and such drawing a line!My only problem with it is the lack of user options, and also it would be great if it would remember last window position and such. - December 21, 2007 by Nilkamal Mher

 Home
Home
